

BI data analysis
Business intelligence analytics drive business growth
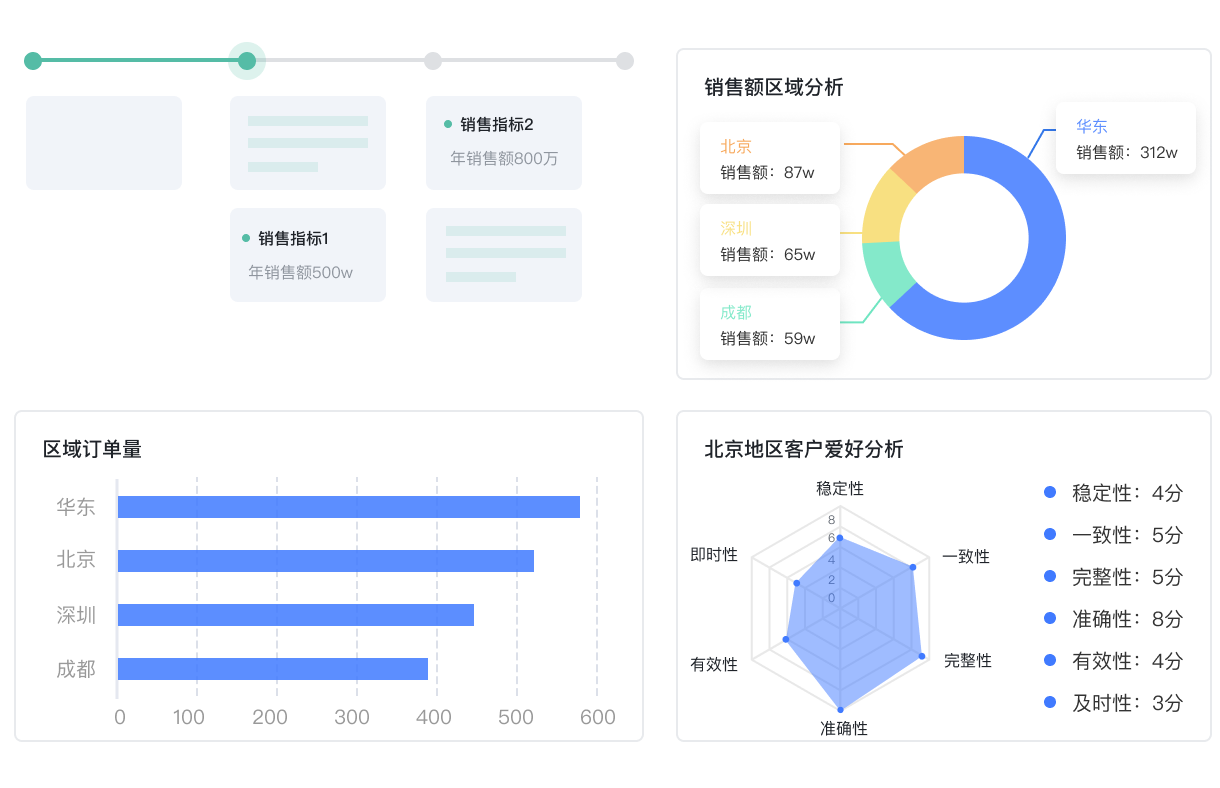
Supports multiple data sources, rich chart types, and dynamic interactive analysis, turning data into an enterprise asset, and empowering every business decision through visual reports, intelligent metrics, and data sharing.
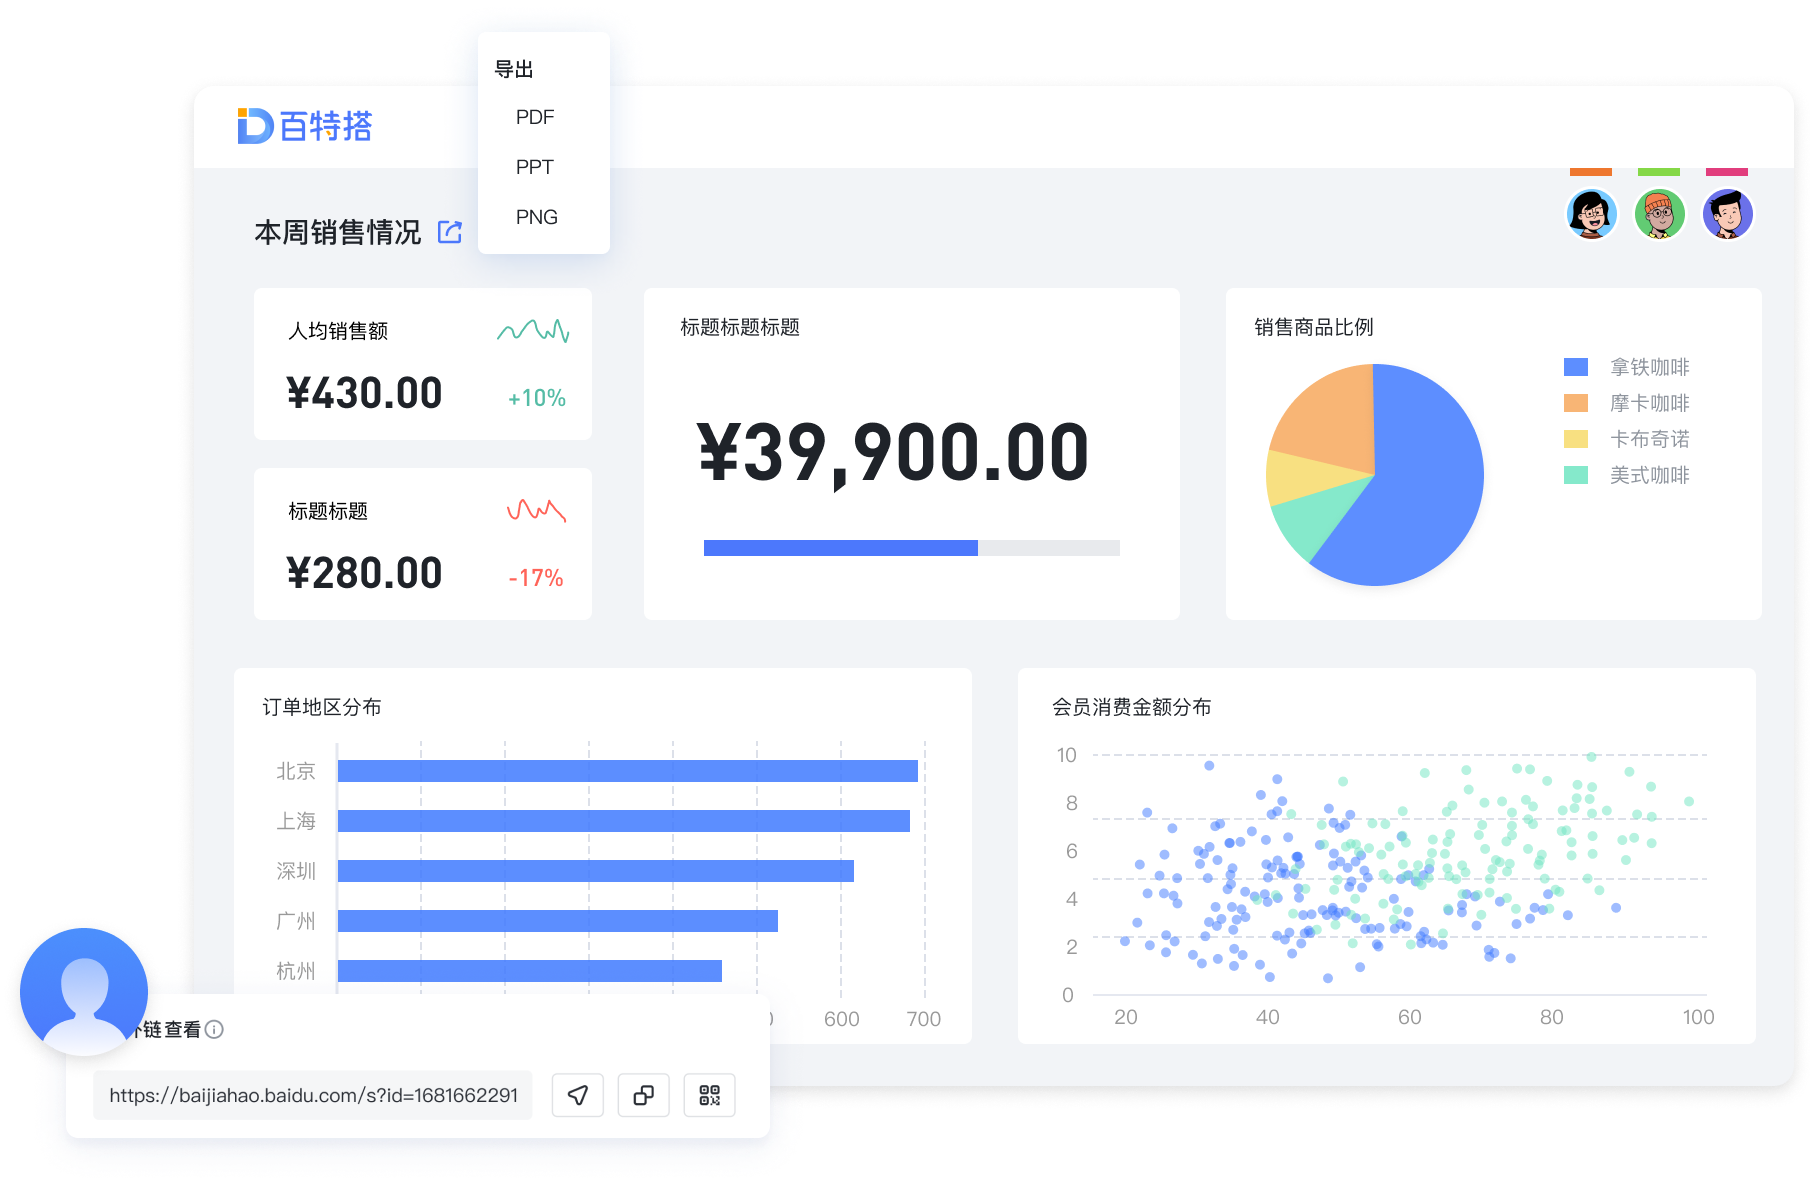

Graphical report development
- Supports graphical tools for dragging and dropping to define data sources and report configurations, making it easy for business staff to customize report logic
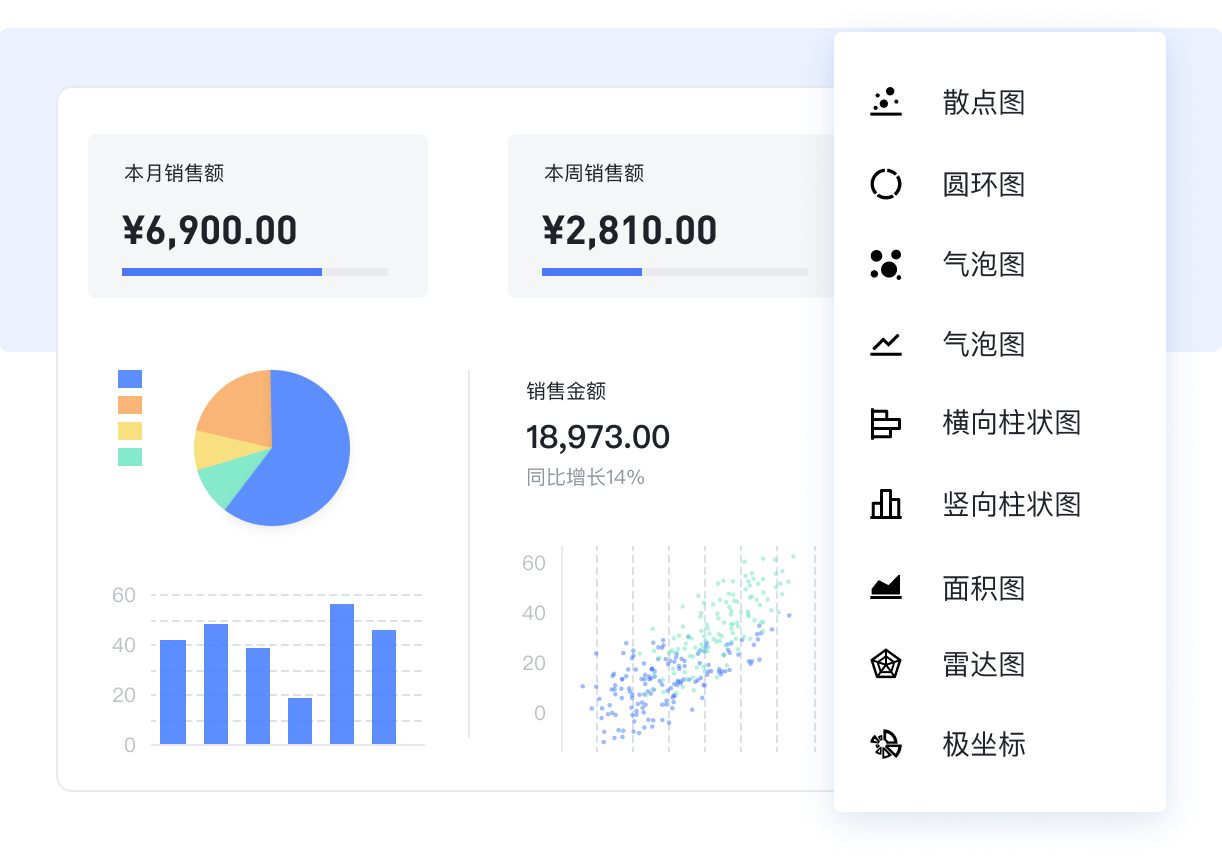
- Chinese-style reports, multi-type bar charts/line charts/area charts, relationship charts, box plots, dashboard charts, KPI charts, word clouds, maps, and 40+ commonly used charts

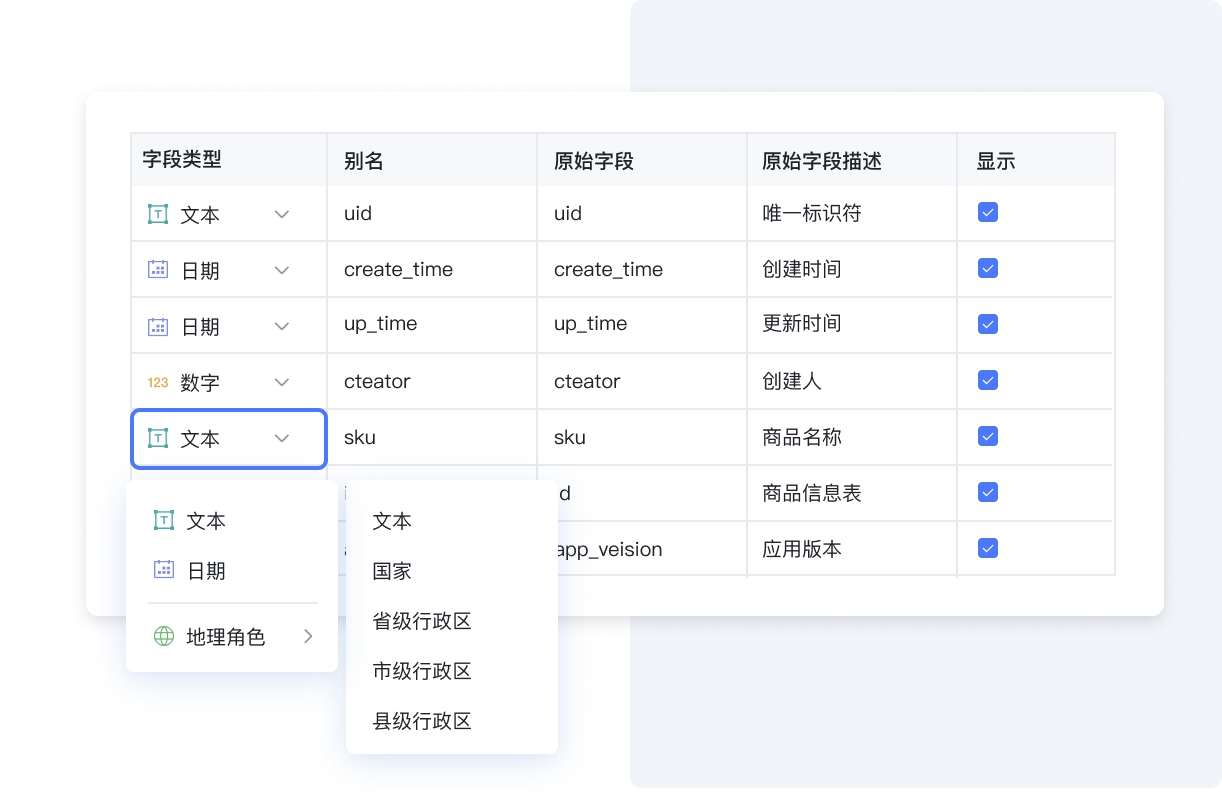
Data scraping
Supports automatic reading and manual settings, enabling retyped processing of fields in the database; Supports setting update execution frequency

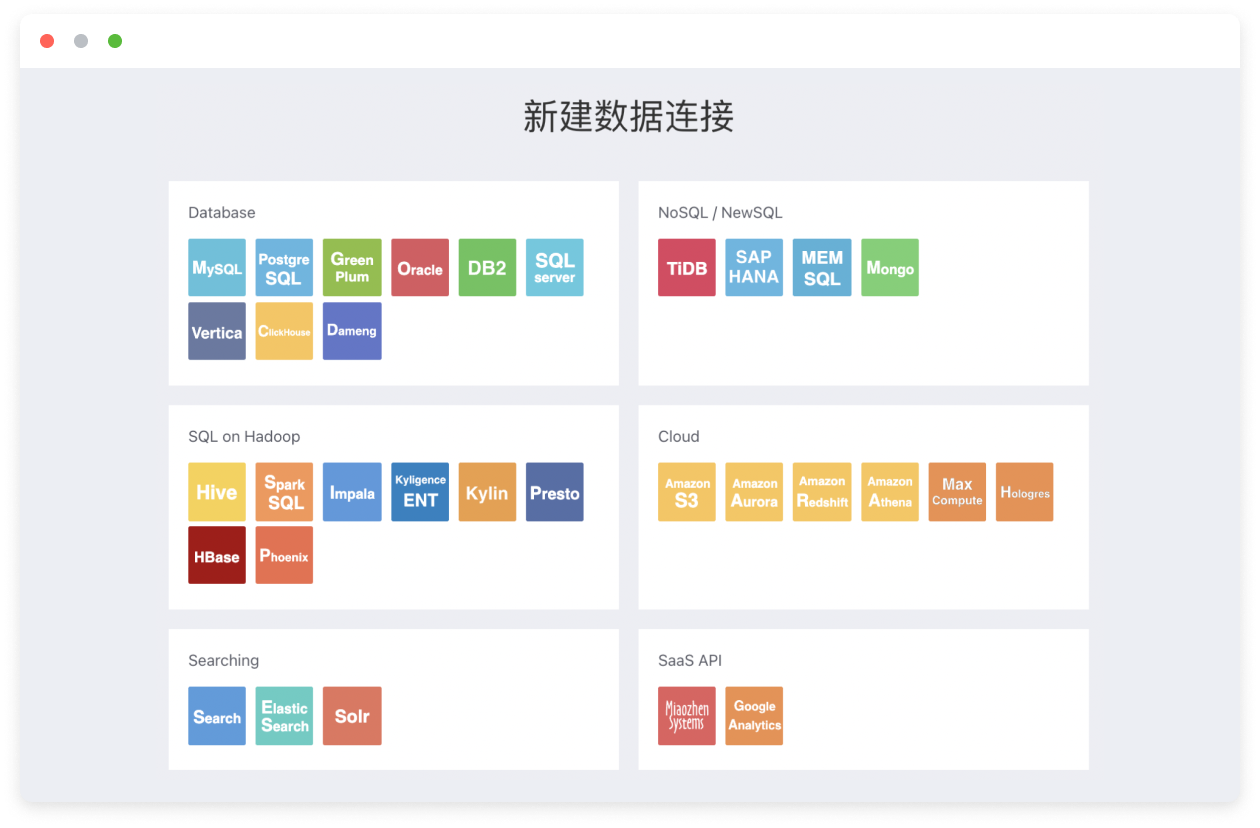
Multiple data sources
- Supports relational data sources such as Oracle, SQL Server, MySQL, PostgreSQL, Vertica, Clickhouse, Greenplum, and DB2
- Supports text data sources such as EXCEL, TXT, CSV
- Supports big data sources such as Hive, Spark, Impala, Presto, and others
- Supports non-relational data sources, such as MongoDB, ElasticSearch, etc
- Supports arbitrary Join tables from different heterogeneous data sources

Dynamic chart analysis
Data linkage, multi-layer drilling, rotation, slicing, free dimension, custom grouping, custom sorting

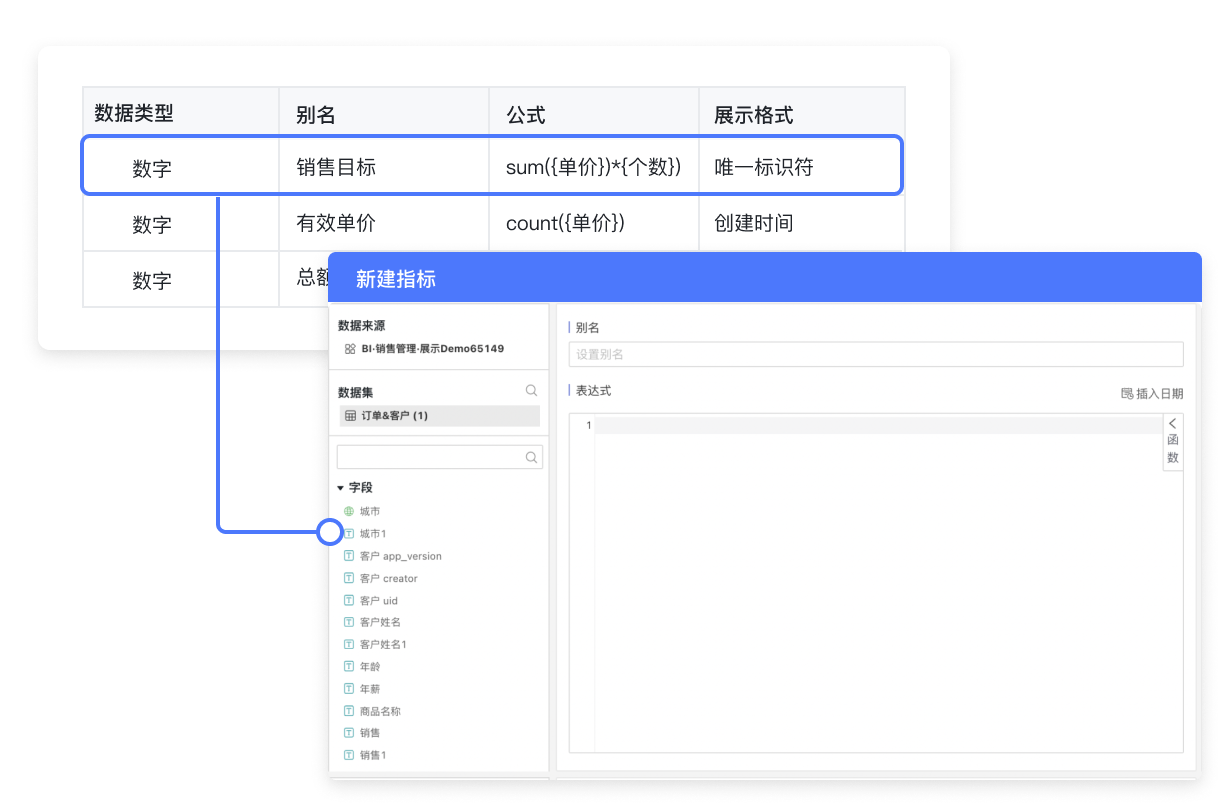
Intelligent indicators
Supports setting multiple data metrics, including automatic calculation of same-year/month-on-month, percentage, cumulative sum, mobile calculation, repeat, retention, activity, and other data metrics. Dynamic tracking of KPIs greatly improves business management and performance analysis efficiency
Want to learn how BI data analysis can be applied to your business scenario?
Schedule a Deneb to discuss and combine your organization, processes, systems, and data status to outline a viable application development path.